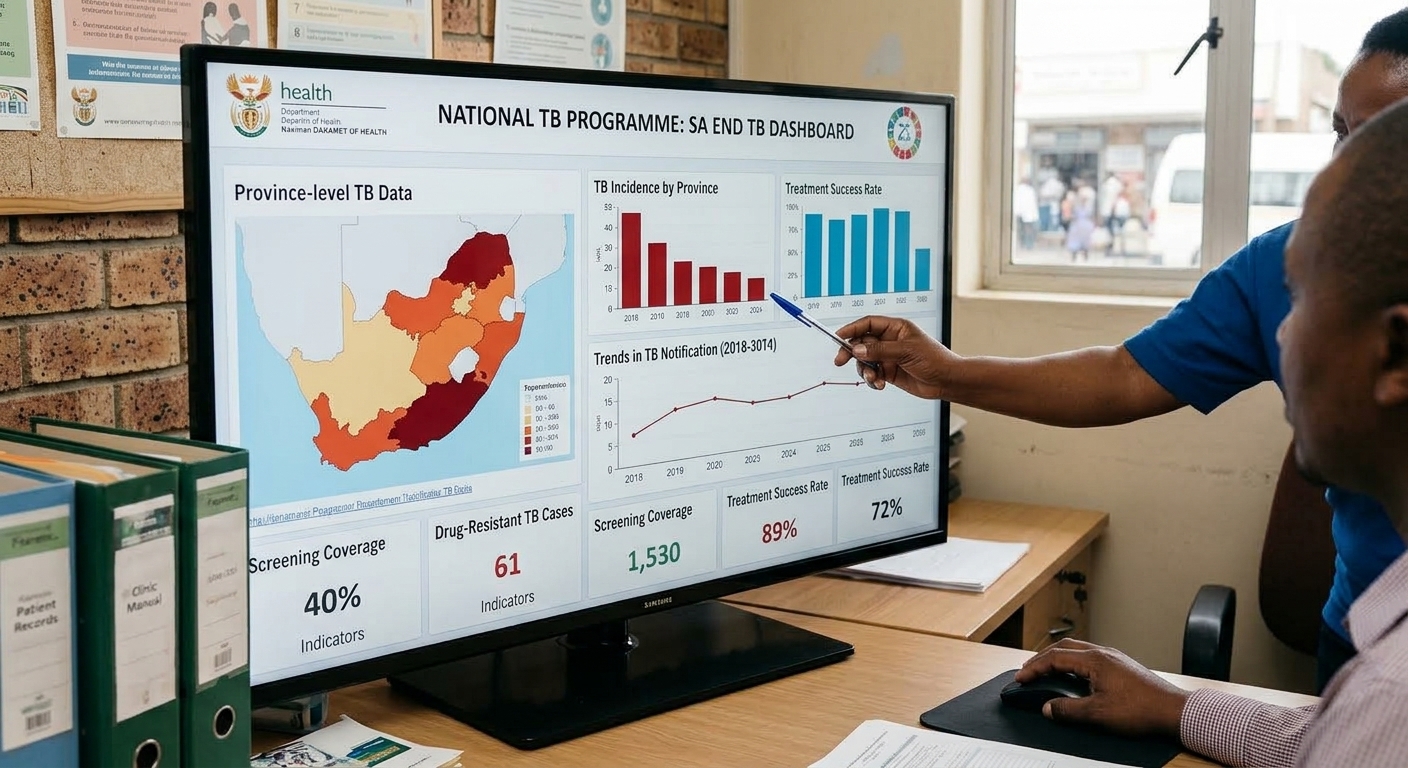
What the data tells us about South Africa’s TB response
By: Aphelele Buqwana
Since its launch last year, the National End TB Dashboard has given researchers, advocates, programme managers and communities a clearer view of how TB testing is being delivered across the country. By making routinely collected testing data publicly available, the dashboard has allowed for closer examination of testing patterns across provinces, districts, age groups and sex.
But South Africa’s efforts to find people with TB earlier continue to face gaps in testing, with access and reach varying across population groups and districts, while 56 000 people die from TB each year.
Having access to the data has created an opportunity to look beyond national testing figures to ask who is being reached, where testing is taking place and which population groups are being missed. This is particularly important as the country works to find people with TB who may not otherwise reach health services.
To understand what the data really means, TBAC has done an analysis of the full year data set from April 2025 to March 2026 and in the next month it will release the report with the full findings.
Ahead of the report, TBAC sat down with its lead Data Driven Advocacy analyst, Dr Andrew Medina-Marino, to discuss the findings and what they reveal about who is being reached, where gaps remain and what could strengthen TB testing services.
Q: Why is this data important?
AM: South Africa has taken an important step by making routinely collected TB testing data publicly available through the National TB Dashboard. This gives researchers, advocates, programme managers and communities a shared evidence base to understand what testing services are delivering and where improvements may be needed.
It also responds to longstanding calls from civil society for greater transparency and participation in the TB response.
The report builds on that by analysing the data, accounting for differences in population size and making important patterns easier to understand. Public access to data becomes more valuable when people can use the information to ask informed questions, discuss solutions and hold programmes accountable for their commitments.
Q: What does the data show?
AM: During the campaign’s first year, about 3.1 million people were tested, representing about 62% of the national testing target. Nearly 160,000 people had a positive TB result. Testing remained below the national monthly target throughout the year and did not show a sustained month-on-month increase. There were also substantial geographic differences. Some districts tested nearly 12% of their population, while others tested about 1.3%.
One of the clearest findings concerned boys and men. After accounting for population size, their testing rate was about one-third lower than that of girls and women, while their rate of laboratory-confirmed TB detection was about 60% higher.
Male testing rates were lower in 47 of 52 districts, but male TB detection rates were higher in all 52. The testing gap was particularly pronounced among young and working-aged men. These findings raise important questions about who testing services are reaching. However, the dashboard cannot explain the reasons for these differences or tell us whether people with positive results subsequently started treatment.
Q: How is this report different from the previous data?
AM: The new report covers the complete first year of the campaign, from April 2025 to March 2026, and provides a much more detailed reference resource. It examines monthly testing patterns and includes analyses by sex and five-year age group across all nine provinces and 52 districts.
The narrower age groups help reveal differences that can disappear when younger and older people are grouped together. The district-level analysis also shows local variation that provincial averages can conceal. This means readers can examine the places and population groups most relevant to their own work.
The report also explains more fully what the dashboard can and cannot tell us, including the distinction between finding someone with a positive laboratory result and knowing that they started treatment.
Q: How does it compare with the data analysed for the State of TB report?
AM: The State of TB report examined the first ten months of the campaign, from April 2025 to January 2026, and reported about 2.53 million people tested, reaching 60.8% of the testing target for that period. The full-year review broadly reinforces its main findings: testing remained below target, results varied geographically, and men were tested less often despite accounting for more positive results. The earlier report had already highlighted the importance of accounting for population size and looking closely at differences by sex and age.
The new report extends that work with two additional months of data and substantially more district-level detail. It shows that the broad concerns identified earlier remain evident across the complete first year. These are overlapping periods within the same campaign year, so the comparison should not be presented as a year-on-year improvement.
Q: Why are these findings important?
AM: The findings help focus attention on whether testing services are reaching the people who need them most. Reaching a numerical testing target is valuable, but we also need to understand who is being tested, through which services and whether people found to have TB are connected to treatment. The report gives programme managers and communities specific geographic and population differences to investigate, while recognising that the dashboard alone cannot explain why those differences occur.
This can help guide improvements within clinics and the development and evaluation of community-based services for people who do not routinely attend health facilities. It also points to the need for clearer target-setting, better information about testing pathways and stronger links between testing and treatment data.
For civil society, the findings provide concrete evidence to support dialogue with government about access, service delivery and the use of limited resources. Ultimately, the value of this work will lie in whether it helps services find people with TB who would otherwise remain undiagnosed and ensures that they start treatment.

Dr Andrew Medina-Marino
Data Driven Advocacy Lead at RHAP and TBAC, and an Associate Professor at Stellenbosch University